Total Cost of Ownership Tells a Different Story: The Financial Case for Strategic Asian Manufacturing
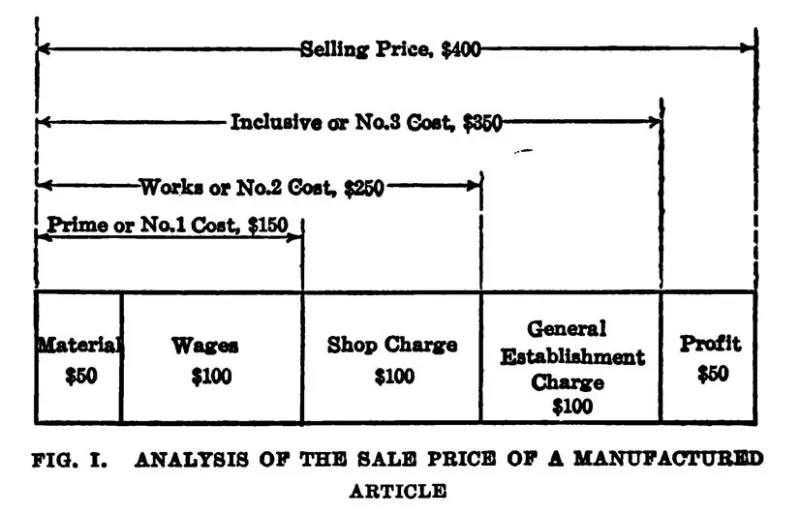
Photo: Alexander Hamilton Church, Public domain, via Wikimedia Commons
The Narrative vs. The Numbers
For many US procurement leaders and CFOs, the phrase "Made in America" carries weight that extends beyond economics. It signals reliability, quality, and patriotism—values that resonate deeply with both internal stakeholders and end customers. But when finance teams conduct a thorough total cost of ownership (TCO) analysis, the assumptions embedded in that narrative frequently fail to hold up under scrutiny.
This is not an argument against domestic manufacturing. American facilities offer genuine advantages in certain product categories, for certain volumes, and under certain regulatory conditions. The more useful question—one that sophisticated procurement teams are increasingly asking—is: where does domestic production deliver superior value, and where does it quietly erode it?
The answer, backed by detailed financial modeling across multiple industry verticals, suggests that selective offshore partnerships with qualified Asian manufacturers can reduce total cost of ownership by 40 to 55 percent in a surprisingly broad range of scenarios. Understanding how requires dismantling several widely held cost assumptions.
Why "Unit Cost" Is the Wrong Metric
The most common error in manufacturing cost comparisons is treating unit cost as the primary variable. A domestic facility may quote $18.50 per component. An Asian partner quotes $9.20. The procurement team adds $1.80 for freight and $0.60 for quality oversight, arriving at $11.60—and concludes the offshore option saves $6.90 per unit. That analysis is incomplete, but it is also not wrong in the ways most critics assume.
The more common distortion runs in the opposite direction: domestic unit costs are frequently understated because they exclude overhead allocations, minimum order constraints, and the hidden cost of limited production flexibility. A US facility operating at 70 percent capacity to serve one customer's variable demand is not a neutral cost center. That idle capacity has a price, and it typically falls on the buyer.
Asian manufacturing partnerships—particularly those structured with experienced intermediaries or established global sourcing firms—often provide access to facilities running at optimized utilization rates, with amortized tooling costs spread across broader production volumes. The per-unit economics reflect that efficiency.
Cash Flow as a Competitive Advantage
One of the least-discussed advantages of offshore manufacturing partnerships is their effect on working capital. Domestic suppliers, particularly smaller contract manufacturers, frequently require 50 percent deposits and net-30 payment terms that compress cash cycles. Larger Asian manufacturing operations—especially those with established relationships with US-facing intermediaries—often offer extended payment structures that allow buyers to receive and partially sell inventory before full payment comes due.
For a mid-sized US company producing $8 million in annual goods, the difference between net-30 and net-60 payment terms represents meaningful liquidity. When that differential is modeled across a full fiscal year, the effective financing value can offset a significant portion of logistics costs—a factor rarely captured in simple unit-cost comparisons.
Additionally, the minimum order quantities typical of domestic specialty manufacturers often force buyers to carry excess inventory to justify production runs. Offshore partners, particularly in China's Pearl River Delta and Yangtze River Delta manufacturing corridors, have increasingly adapted to smaller batch production, reducing the inventory burden on US buyers and improving the cash conversion cycle.
Innovation Velocity and the Cost of Slow Iteration
Product development timelines represent another underweighted factor in TCO calculations. US contract manufacturers, operating with constrained tooling infrastructure and smaller engineering support teams, often require eight to fourteen weeks for prototype-to-sample cycles. Leading Chinese precision manufacturers—those with in-house design engineering, CNC machining, and surface treatment capabilities under one roof—regularly compress that timeline to three to five weeks.
For a consumer electronics company launching a seasonal product, or an industrial equipment manufacturer responding to a customer specification change, that difference is not merely a scheduling convenience. It is a competitive variable with direct revenue implications. Faster iteration cycles mean more design generations before market launch, higher product-market fit, and reduced post-launch engineering costs.
When the cost of delayed time-to-market is incorporated into a TCO model—even conservatively, using a fraction of estimated revenue impact—the innovation velocity advantage of well-resourced offshore partners frequently exceeds the total logistics cost of the offshore arrangement.
What Logistics and Oversight Actually Cost
Critics of offshore manufacturing correctly identify freight, customs, and quality oversight as real cost centers that domestic production avoids. These objections deserve honest treatment rather than dismissal.
Ocean freight from major Chinese ports to US West Coast destinations for a standard 40-foot container currently ranges from $1,800 to $3,500 depending on market conditions—a cost that fluctuates but remains manageable for most production volumes. Duty rates vary by product category and trade classification, and experienced sourcing teams build these into landed cost models as a matter of standard practice.
Quality oversight is more nuanced. Companies that attempt offshore manufacturing without structured inspection protocols do incur higher defect costs and rework expenses. However, companies that establish clear quality frameworks—including pre-shipment inspection, statistical process control requirements, and defined corrective action procedures—typically find that defect rates at qualified Asian facilities are comparable to, and in precision categories often lower than, domestic alternatives. The investment in quality infrastructure is real, but it is a one-time capability-building cost rather than an ongoing variable expense.
When logistics and oversight costs are modeled accurately—not inflated as a rhetorical device, and not minimized as an inconvenience—the offshore TCO advantage in the 40 to 55 percent range holds across most medium-to-high volume manufacturing scenarios.
Building the Right Model for Your Business
Not every product category benefits equally from offshore manufacturing partnerships. High-mix, low-volume production with frequent specification changes may favor domestic facilities, particularly where proximity reduces communication latency. Products subject to ITAR controls or highly sensitive IP considerations require additional structural safeguards that affect the economics. These are legitimate constraints, and a credible TCO analysis accounts for them.
What the analysis should not do is begin with a conclusion. The "Made in America" premium is a real market positioning tool for certain consumer segments. But for the majority of industrial, commercial, and component manufacturing decisions, the total cost of ownership framework—applied rigorously and without ideological bias—consistently points toward a hybrid model in which strategic Asian manufacturing partnerships carry a substantial share of production volume.
The companies that have internalized this logic are not abandoning domestic manufacturing. They are allocating production intelligently, reserving domestic capacity for the work where it delivers genuine advantage, and leveraging global partnerships for the volume and precision work where the economics are simply stronger.
That is not a compromise. It is a competitive strategy.